2024 HUD Income Limit Outlook
Published by Thomas Stagg on Monday, October 16, 2023 - 12:00AM
With the releases of the 2022 American Community Survey (ACS) data in September, there are two primary questions regarding 2024 income limits:
- What will the U.S. Department of Housing and Urban Development (HUD) do with the cap?
- How much of an impact will the slowdown in inflation have on the limits?
Before addressing those questions, it’s important to know how the industry got here.
The 2022 ACS data is what will likely be used by HUD to calculate the 2024 income limits for low-income housing tax credits (LIHTCs), tax exempt bonds and various HUD programs, including Section 8.
Using the 2024 ACS, Novogradac can start to estimate the 2024 income limits. The good news is that for the 1,400 plus areas that Novogradac can estimate, the average increase in Very Low Income (VLI) is slightly more than 7%. However, this assumes that HUD will use the same cap methodology it used the last two years. If HUD changes its cap methodology, then the average increase may be less than 7%.
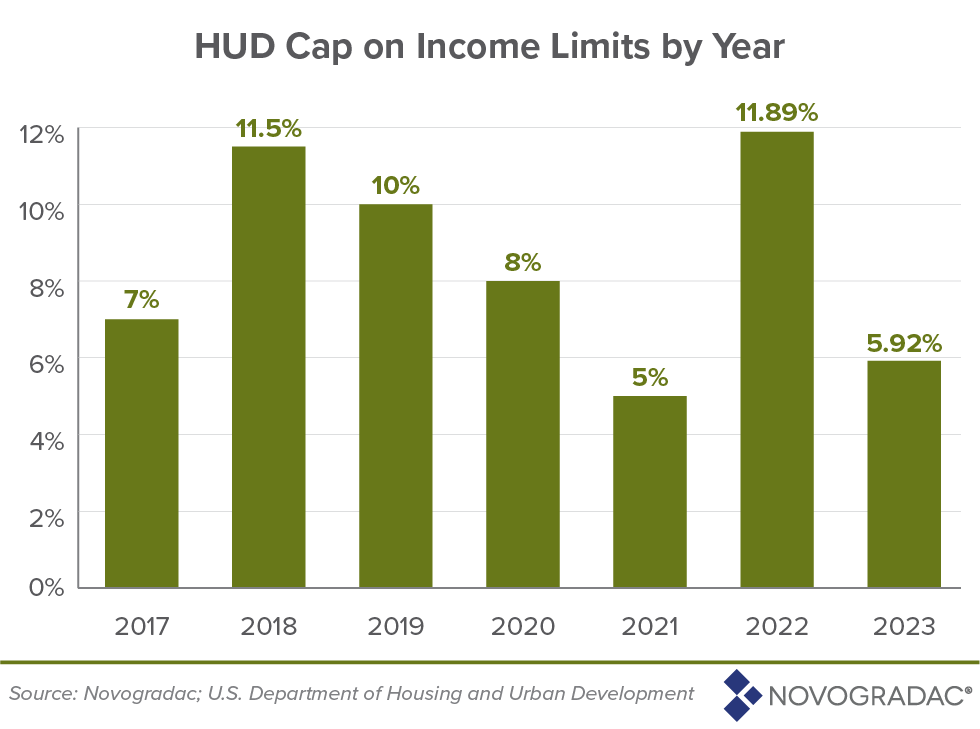
HUD Cap on Income Limits
Novogradac has discussed the cap that HUD applies when calculating VLI Limits, the limits used for LIHTC and tax-exempt bond projects, a few times on the Notes from Novogradac blog (May 26 and July 5), however, a brief overview is that HUD caps increases in VLI at the greater of 5% or two times the change in national median income. For the last two years, HUD has determined the change in national median income by only looking at the change in ACS national median income as opposed to the HUD published national median income figure that considers inflation from when the ACS was released and the income limit year.
If HUD continues to use the same methodology that it used for 2022 and 2023 then Novogradac is estimating that the cap will be 14.78%, which is two times the change between the 2021 and 2022 ACS national median income. However, if HUD were to revert back to the pre-2022 methodology, the cap would only be 5%.
Obviously, there is a huge difference between a 14.78% cap and a 5% cap. If cap is 14.78%, Novogradac estimates that around 11% of areas the firm can estimate would be capped. Alternatively, if the cap is 5%, Novogradac estimated that more than 60% of the areas that the firm can estimate would be capped. If the cap is 5%, this would be the third year in a row that a substantial portion of the areas were capped.
Historically speaking, a cap of 14.78% would be the highest cap amount and would be an outlier compared to the last few years. The previous high cap was 11.89% in 2022.
The fact that the cap would be the highest cap to date does cause some concern that HUD may want to slow down the cap. If HUD continues to cap a substantial portion of areas again in 2024, it will have a negative impact on LIHTC properties. LIHTC and tax-exempt private activity bond properties are unique compared to other federal programs as their rent limits are directly impacted by the income limits for the area. When income limits are capped, rents are capped as well. Capped rents are detrimental to a property’s ability to cover operating expenses and debt service, especially in high inflationary times like the industry has experienced over the last few years. Furthermore, some expenses, such as insurance, are increasing in exponential ways.
Of significant concern is the impact of capped rents on the critical affordable housing units currently in the development process. In addition to the rising operating costs mentioned above, capped rents will impact a property’s ability to underwrite debt permanently. In an era of increasing interest rates, capping rents will contribute to properties that would have been feasible on initial analysis no longer being feasible.
Furthermore, depressed rent levels will cool development work under consideration precisely as the nation faces a growing crisis in affordable housing development.
Finally, tenants seeking housing are also impacted by lower income limits. If real incomes are increasing faster than HUD is allowing incomes limits to increase due to the cap, tenants who would otherwise qualify for housing would be excluded. For example, if the capped income limits is $50,000 and the uncapped income limit is $53,000 anyone making between $50,000 and $53,000 in this area would not be able to qualify solely due to HUD’s cap on income limit increases.
HUD has informally stated that the change in cap methodology over the last few years was to help make sure that wages were actually increasing and it wasn’t just inflation that was driving the increase in income limits. In a year where the ACS data shows that the national median income increase by 7.39%, it wouldn’t make sense to have a cap 5% that is even less than the change in ACS national median income.
We do not know what the cap will be for next year, however, it is likely it will be somewhere between 5% and 14.78%. Areas that are estimating an increase over 5% should use caution as HUD may cap increases at 5%.
Inflation Factor
The other factor that needs to be examined when discussing the 2024 income limits is the inflation factor. When calculating the area median income (AMI), HUD starts with the ACS data and trends it forward to the applicable income limit year using a CPI trend factor from the ACS year to the income limit year.
For example, 2023 AMI limits were calculated as follows:
2021 ACS * (2023 CBO Estimated CPI/2021 CPI) = 2023 AMI
For 2023, the consumer price index trend factor was 1.12170. Based on the most recent Congressional Budget Office (CBO) 10-Year Economic Projections from July, Novogradac is estimating the 2024 trend factor to be 1.06484. This is a drastic decrease over the previous year due to inflation slowing down over the period from 2022 to 2024 when compared to the period of 2021 to 2023. This will serve as a headwind to income limit growth. A slower trending factor means slowing income growth, especially when compared to the prior year.
Let’s look at a few examples of how this works.
Example 1 Flat ACS
An area where ACS is flat will see a decrease in AMI.

Even though ACS was flat, there is a 5% decrease in AMI because of the decreasing trend factor.
Example 2 Decreasing ACS
In an area where ACS has decreased, there will be an even larger decrease in AMI.
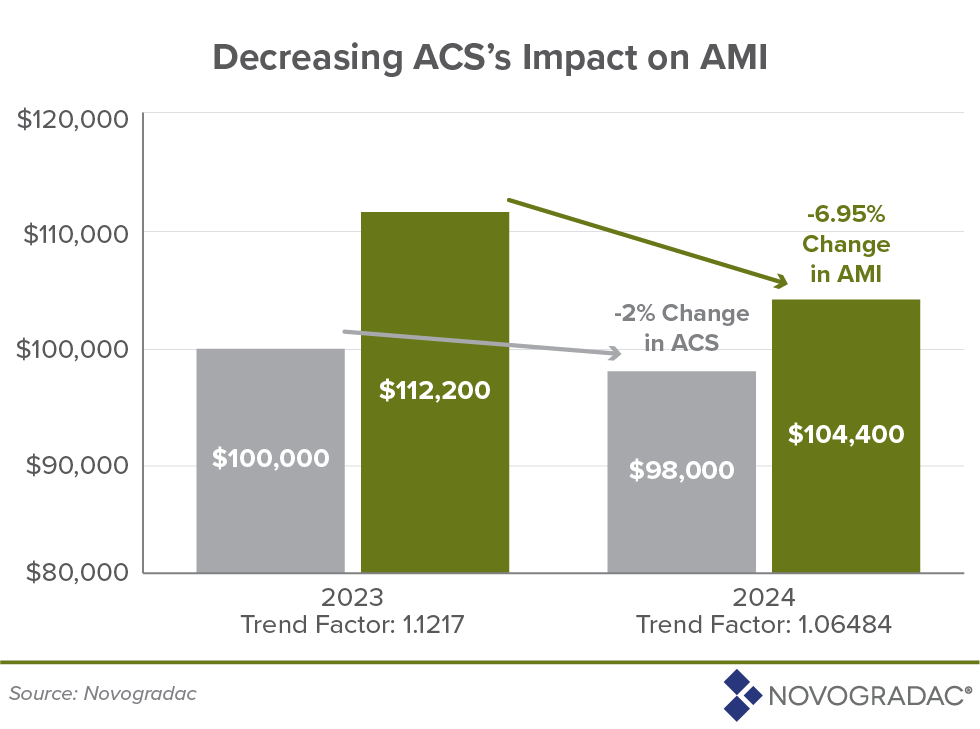
A 2% decrease in ACS results in an almost 7% decrease in AMI.
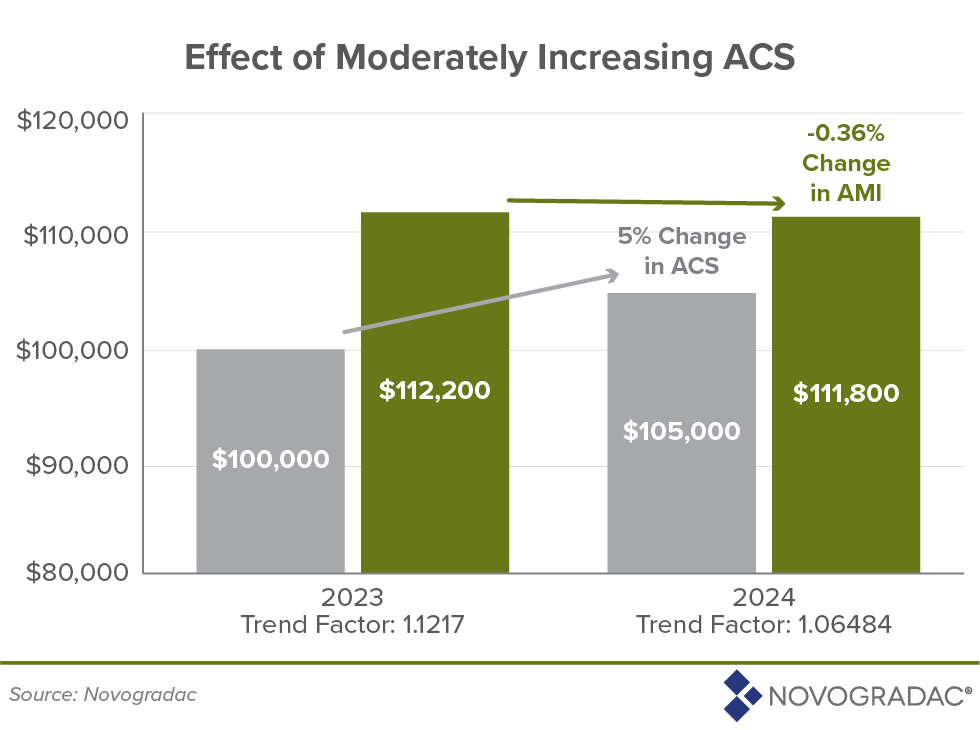
Example 3 Moderate Increasing ACS
An area where the ACS is increasing at a rate lower than the decrease in the trend factor will result in a decrease in AMI. Using the current trend factor, if the ACS increases by less than 5% the area would have a decrease in AMI.
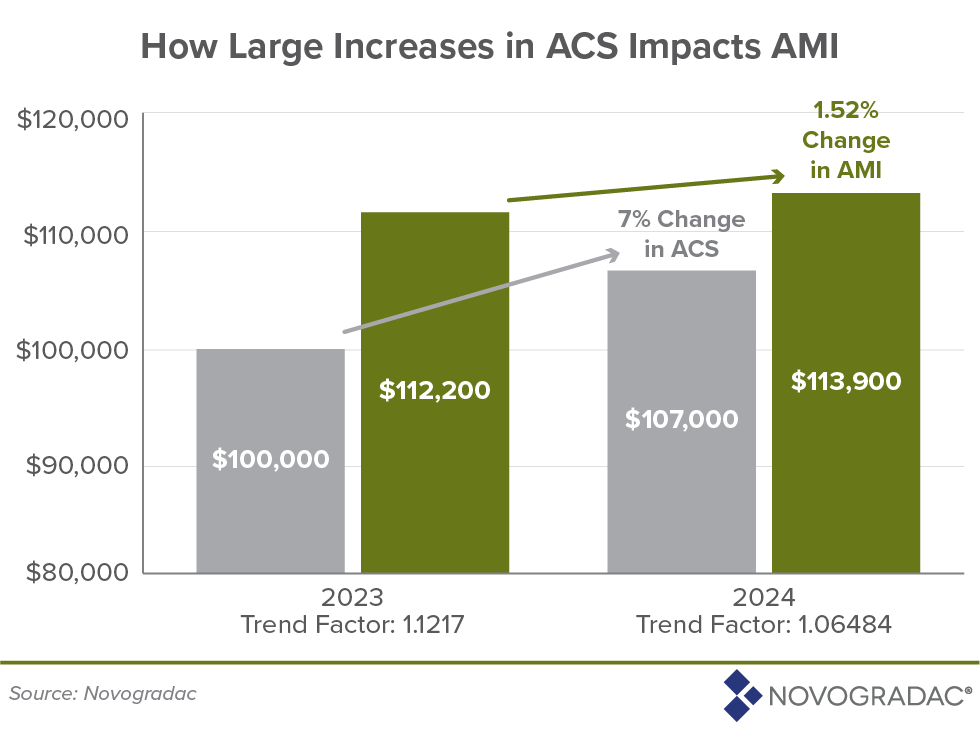
Example 4 Large Increasing ACS
An area would need to have an increase of greater than 5% in ACS to see an increase in AMI using the current trend factor.
Based on this, one would think that AMI would be decreasing across the board, however, there are two mitigating factors that will lessen the impact of the inflation factor headwind–large increase in ACS data and the impact of the capped areas from 2023.
Large ACS Increase
First, ACS is showing very strong increases from 2021 to 2022. The ACS national median income increased by over 7.38% from 2022 to 2023, which means that even though the trend factor is 5% lower than last year, the average increase in AMI is right around 2%. The change in national median income will help illustrate this point:

As can be seen above, even though the national median ACS increased by 7.39% from 2021 ACS to the 2022 ACS this translates into only a 1.98% increase in national median income from 2023 to 2024 due to the trend factor.
As mentioned before, this analysis is based on the July 2023 CBO estimate of CPI for 2024. Before HUD publishes the 2024 income limits, the CBO will likely publish another CPI estimate. CBO typically publishes a CPI update in January of each year. If the CBO CPI estimate is lower in January 2024 than it was in July of 2023, this will slow down the trend factor even further and result in an even lower AMI. Conversely if the CBO CPI estimate is higher in January, then the trend factor will increase, and AMI will increase as well.
Impact of the 2023 Cap
Once HUD has determined AMI, it applies a series of adjustments to calculate the VLI, which is the income limit used for LIHTC and tax-exempt bond developments. (This Notes from Novogradac blog post can assist in explaining the differences between AMI and VLI).
One of the adjustments that HUD applies is a cap on income limits increases. As discussed in earlier blog posts, the cap for 2023 impacted more than 85% of the areas in 2023. Although the cap does not guarantee an area will have an increase, it does help mitigate the impact of the decrease in AMI. The average change in AMI for the areas that we can estimate is 2%, however, the average change in VLI is 7%. VLI is increased at a 5% faster rate than AMI. This is due to the adjustments HUD applies when calculating VLI. The adjustment that is impacting the most areas is the cap from the prior year. (Note the other adjustment that is having an impact is the high housing cost adjustment due to the large increase in fair market rents (FMRs). To read more about FMRs and their impact on the 2024 income limits, see this blog post).
The following example shows how the cap and decreasing trend factor combine to impact VLI.
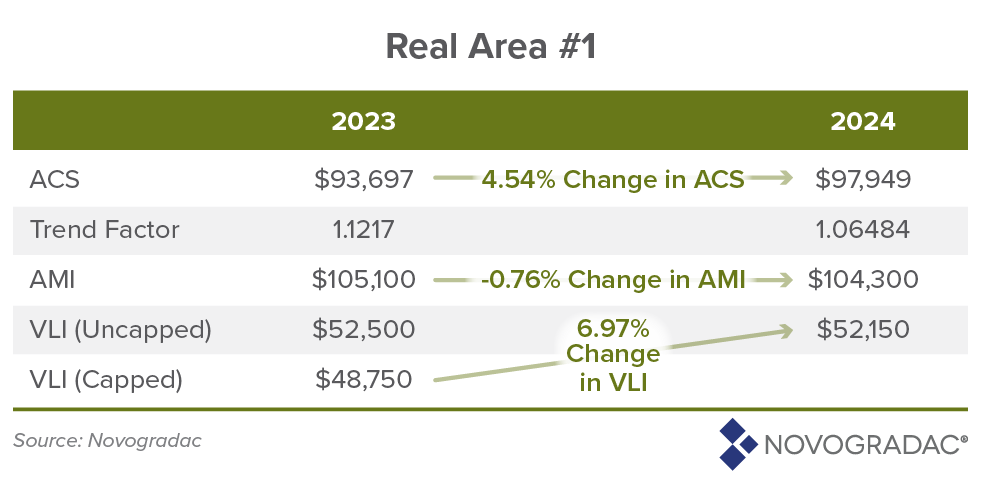
This area had a VLI that was capped at $48,750 for 2023. However, if there was no cap, the VLI would have been $52,550. ACS for this area increased by 4.54%, which due to the trend factor actually results in a 0.76% decrease in AMI for 2024. The AMI of $104,300 resulted in a VLI of $52,150, which is 6.97% higher than the capped VLI of $48,750 amount in 2023. Please note, this is the preliminary VLI and is still subject to HUD’s cap, which as discussed earlier could be as low as 5% and as high as 14.78%.
However, the cap carryforward from 2023 won’t always result in a large increase. Consider this example:
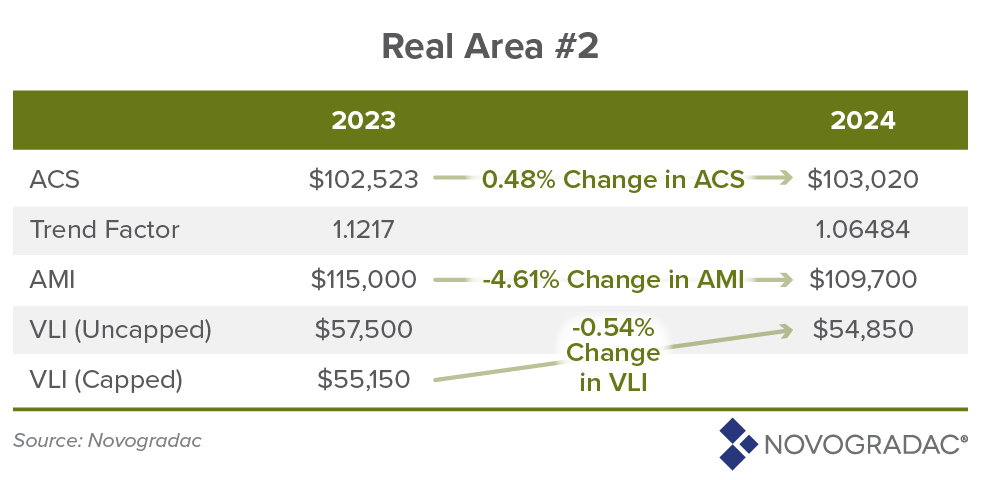
This area had a large spread between the capped VLI and uncapped VLI in 2023. ACS went up slightly, but due to the lower trend factor in 2024 AMI decreased by 4.61%. The cap from 2023 helps mitigate the decrease in AMI, but the result is still a small decrease in VLI for 2024.
Finally, when ACS decreases from 2021 to 2022 for an area, it will be difficult for the cap to completely mitigate the decrease unless the cap was very large. The following real area had a large decrease in ACS.
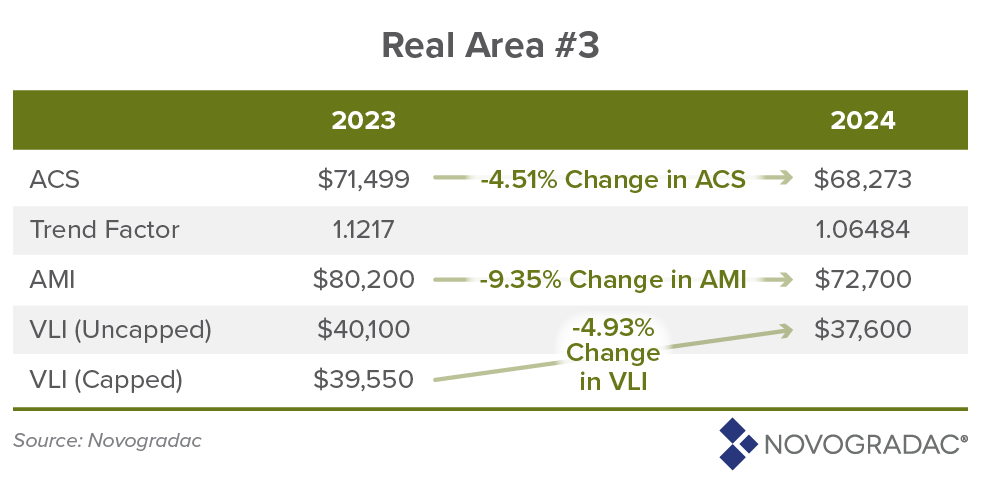
Once the decrease in ACS is compounded with the slowing trend factor this area has a 9.35% decrease in AMI. This area did not have as large of a spread between capped VLI and uncapped VLI, and therefore, is not able to overcome the decrease in ACS and lower trend factor. These elements combine to have a 4.93% decrease in VLI.
2024 Outlook
Next year will be another exciting year for income limits. Although the final CBO CPI information is not available yet, Novogradac is able to estimate income limits for many areas for 2024. The estimates for individual areas can be ordered through the Novogradac website.
Based on our preliminary estimate, Novogradac estimated that around 3% of areas will have a VLI lower in 2024 than it was in 2023. However, similar to last year, many areas will have increases. In fact, 58% of areas will have an increase that is greater than 6%. Please see below for the strata of income limit increase by areas:
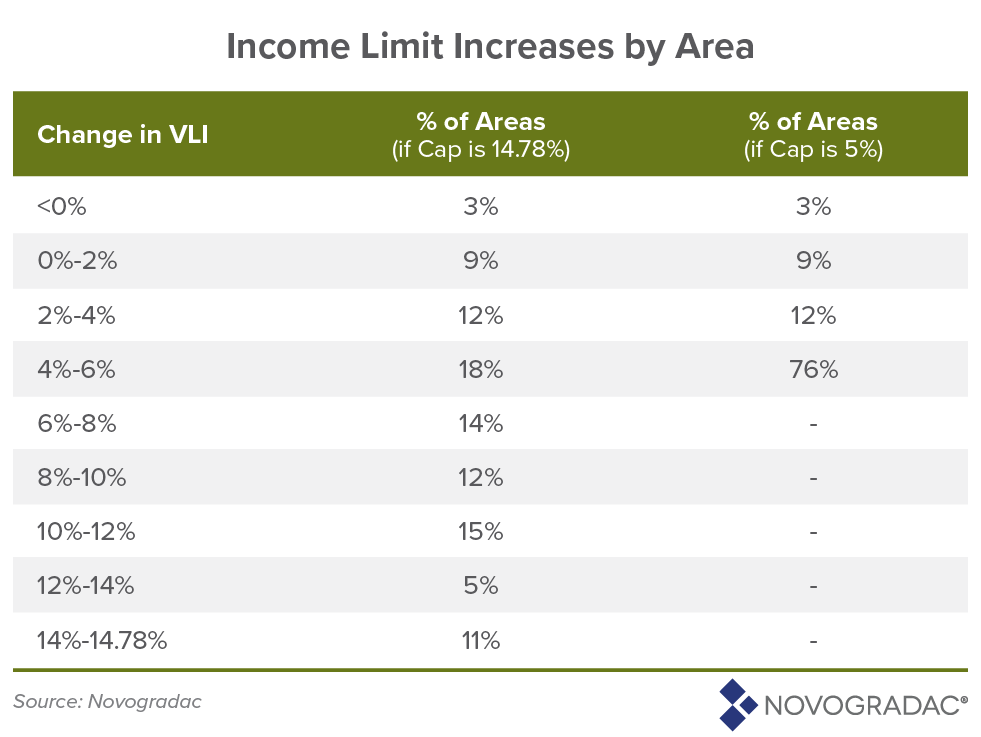
As can be seen if HUD uses a cap of 5% a large portion of areas will be capped again.
The Novogradac Rent & Income Limit Calculator© is an excellent resource for housing professionals who have an understanding of income and rent limits and the program requirements for each program. Or, if you have questions about the income limits, or would like to engage Novogradac to calculate the rent and income limits for your property, please contact Thomas Stagg at [email protected].
